Create 1, 2, or 3 different graphs to display the data above. For a clearer image of the data, click here. Use the Create-A-Graph website to make a graph of the data. Be sure to include a title and label your axes.
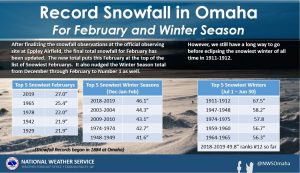
Top 5 Snowiest Februarys
The Top 5 Snowiest Winter Seasons (Dec-Jan-Feb)
Top 5 Snowiest Winters (Jul 1- Jun 20).
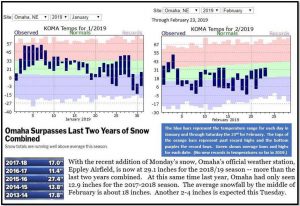
Take a look at the graphs in the image below. For a clearer image of the graphs, click here. The information in the blue box is particularly helpful in reading the graphs. Answer any of the following questions by leaving a comment and/or leave a question for someone else to answer.
How many times in January/February 2019 did the temperature range fall mainly in the record highs? What about the record lows?
On how many dates was the temperature range very small (short blue bar)?
How many times did the temperature range fall in the average section (green)?