3. Print out the PDF or make a copy of the digital version of the doughnut activity page. Due to the complexity of some of the questions, It’s acceptable to use your resources (ie. teacher, older brother or sister, Internet to look up a formula, etc.) and ask for help.
4. Share your math mini spark recording page with your teacher/EY coordinator.
Math concepts are fantastically weaved into all kinds of artwork and Cloud Gate, or “The Bean”, in Chicago, IL is no exception! Cloud Gate is British artist Anish Kapoor’s first public outdoor work in the the United States.
1. Set up your math mini spark recording page: #24: The Bean
2. According to the city of Chicago website, The 110-ton elliptical sculpture is forged of a seamless series of highly polished stainless steel plates, which reflect Chicago’s famous skyline and the clouds above. A 12-foot-high arch provides a “gate” to the concave chamber beneath the sculpture, inviting visitors to touch its mirror-like surface and see their image reflected back from a variety of perspectives. Inspired by liquid mercury, the sculpture is among the largest of its kind in the world, measuring 66-feet long by 33-feet high. Watch this summary video below and record 5-10 details on your recording page.
3. Watch a video on how they “Clean the Bean”. Record 3 sentences about what you have learned about this process on your recording page.
4. Take a look inside the Bean during construction. What math and science was involved in creating the bean?
5. “The Bean” is 33 feet high, 42 feet wide, and 66 feet long. It weighs about 110 tons — roughly the same as 15 adult elephants. Suppose a regular bean was sitting next to Cloud Gate. Do some research to find out the dimensions of a regular bean. Do some math calculations. About how many times bigger is cloud gate? Record your work on your recording page.
6. Share your math mini spark recording page with your teacher/EY coordinator.
Thanks to the Hoffart boys at Sunset for inspiring this math mini spark!
infographic |ˌinfōˈɡrafik| noun- a visual image such as a chart or diagram used to represent information or data. a good infographic is worth a thousand words.
I went out to lunch recently with my family and noticed an eye-catching infographic at the center of each table. I wish I could post a picture of it, but that would ruin the surprise! In this math mini spark you are going to create your own infographic using the data from the restaurant.
Spark your math thinking!
1. Set up your math mini spark recording page: #23: A Yummy Infographic
2. Explore some infographics created for kids. Write about what you noticed/liked/didn’t like on your recording page.
3. Your job is to create a picture/word combo (INFOGRAPHIC) that displays all the information. The only requirement is that all the information below is somewhere on your 8 1/2 x 11 page. Use colors, crayons, pencils, Canva, or another digital tool…whatever!
Data to be included on your infographic…
39,598,080 mini gingerbread muffins devoured last year from this salad bar
1980 was when this restaurant introduced a salad bar. It was based on the suggestion of a radio salesperson.
10,000,000+ salad bars were ordered at this restaurant in 2020
The original salad bar at this restaurant offered 9 ingredients. Now there are 50+ ingredients and they include select USDA-certified organics.
There are 1,906,884 possible combinations for a 5-ingredient salad with a base of lettuce.
If you had 1 salad a day, it would take 5,224 years before repeating a salad combination.
No MSG since 2008 and everything on the salad bar is trans-fat free.
4. Share your minit math spark recording page and infographic with your teacher/EY coordinator.
This mini spark is all about giant pizzas. Take a look at the math involved in making a mile long pizza.
Spark your math thinking!
1. Set up your math mini spark recording page: #22:A Mile of Pizza
2. May 19, 2016: Along the seafront of Naples in Italy, 100 chefs collaborated to create a 1,853.88 metres (6082.2 feet / 1.15 miles) long Neapolitan, which Guinness World Records confirmed is officially the Longest pizza ever made. This record was broken the following year in California.
3. Read this article to find out about all the “numbers” associated with creating the mile-long pizza in Italy! Many of the measurements in the article are given in metric units. Use an online conversion calculator to change any of the measurements from metric to customary. Record these on your recording page.
4. Instead of looking at a mile of pizza , let’s watch a video about a mile of Pi. One your recording page write about what challenges the the researchers faced while doing this project.
5. If you could choose to make a “mile” of your favorite food, what would it be? What ingredients would need? What special tools would you need to have on hand? Write a few paragraphs about your “mile of food” and include an illustration. If you would rather write a story about your mile of food, that is great!
While teaching an enrichment lesson to 3rd graders a few weeks ago, one of them asked what a 13-sided figure was called. Did you know it is a called a TRIDECAGON? Explore polygons and polygon names in this math mini spark.
Spark your math thinking!
1. Set up your math mini spark recording page: #21:Tridecagon
2. Choose 2 activities to complete this mini spark
Watch The Greedy Triangle by Marilyn Burns. Reading this book aloud is my favorite ways to start a geometry unit. After watching the video, make a recording on your recording page about your favorite shape and where it appears most often. Pick a polygon and draw 4-5 pictures of where that shape appears.
At Math is Fun, research the names of polygons that you don’t already know and create a visual showing what you have learned.
Create a “Geometry Around Us Presentation.” Look at this example: as a starting point. You can use any tool (Explain Everything, Pic Collage, Canva, etc.) and include as many vocabulary words as you like. Try to find pictures of polygons in your school or outside.
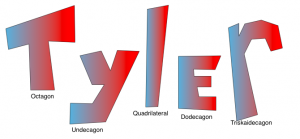
Write your name in block polygon letters. Color the letters and under each one, write the correct name for each polygon.
3. Share your math mini spark recording page with your teacher/EY coordinator.
Take Me out to the Ball Game! The baseball/softball season is upon us and what better way to prepare for the fun than by studying the ways in which math is used in these fine sports.
Spark your math thinking!
1. Set up your math mini spark recording page: #20: Take Me Out to the Ball Game
2. Watch this video about how to calculate batting average. Comment about something new you learned from the video on your recording sheet.
Set up your math mini spark recording page: #19 Exponent Exercises
Watch this exponent activity at Khan. Take notes on your recording page.
Review exponents at Math is Fun. Make a mini teaching page about exponents, negative exponents, and what to do it the exponent is 0 or 1 on your recording sheet.
Practice your exponent math by playing Power Play at Transum. Pick the level that fits you. Play the level until you get a trophy. Add a picture of your trophy to your recording page.
5. Share your math mini spark recording page with your teacher/EY coordinator.
Did you know…Among the digits of pi currently known, the concentration of each of the digits 0-9 are pretty close to equal. However, in the first 30 places of pi’s decimal expansion, there is a digit is completely missing? Which digit is it?
Spark your math thinking!
1. Set up your math mini spark recording page: #17: Pi Numbers
2. Below you will see the first 98 digits of pi. Record the number of times each digit appears. Which digit is not used in the first 30 places? Record your discovery on your recording page.
Circles are EVERYWHERE, and wherever there are circles, there’s math to be done!
Spark your math thinking!
Set up your math mini spark recording page: #16: Discover Circles
Read this circle fact page. Record 3-5 ideas on your recording page.
Find circles in your environment and snap some pictures. Make a Pic Collage (or use another app of your choice). Add the finished project to your recording sheet.
This slideshow requires JavaScript.
Get a ruler. Snap a picture of a circle that you have found with a ruler going through the center This is measuring the diameter of the circle. Calculate the circumferenceof the circle by taking pi (3.14) times diameter. C = πd. Record your math and the answer on your recording page
Read the following steps to see how you can get to Pi!
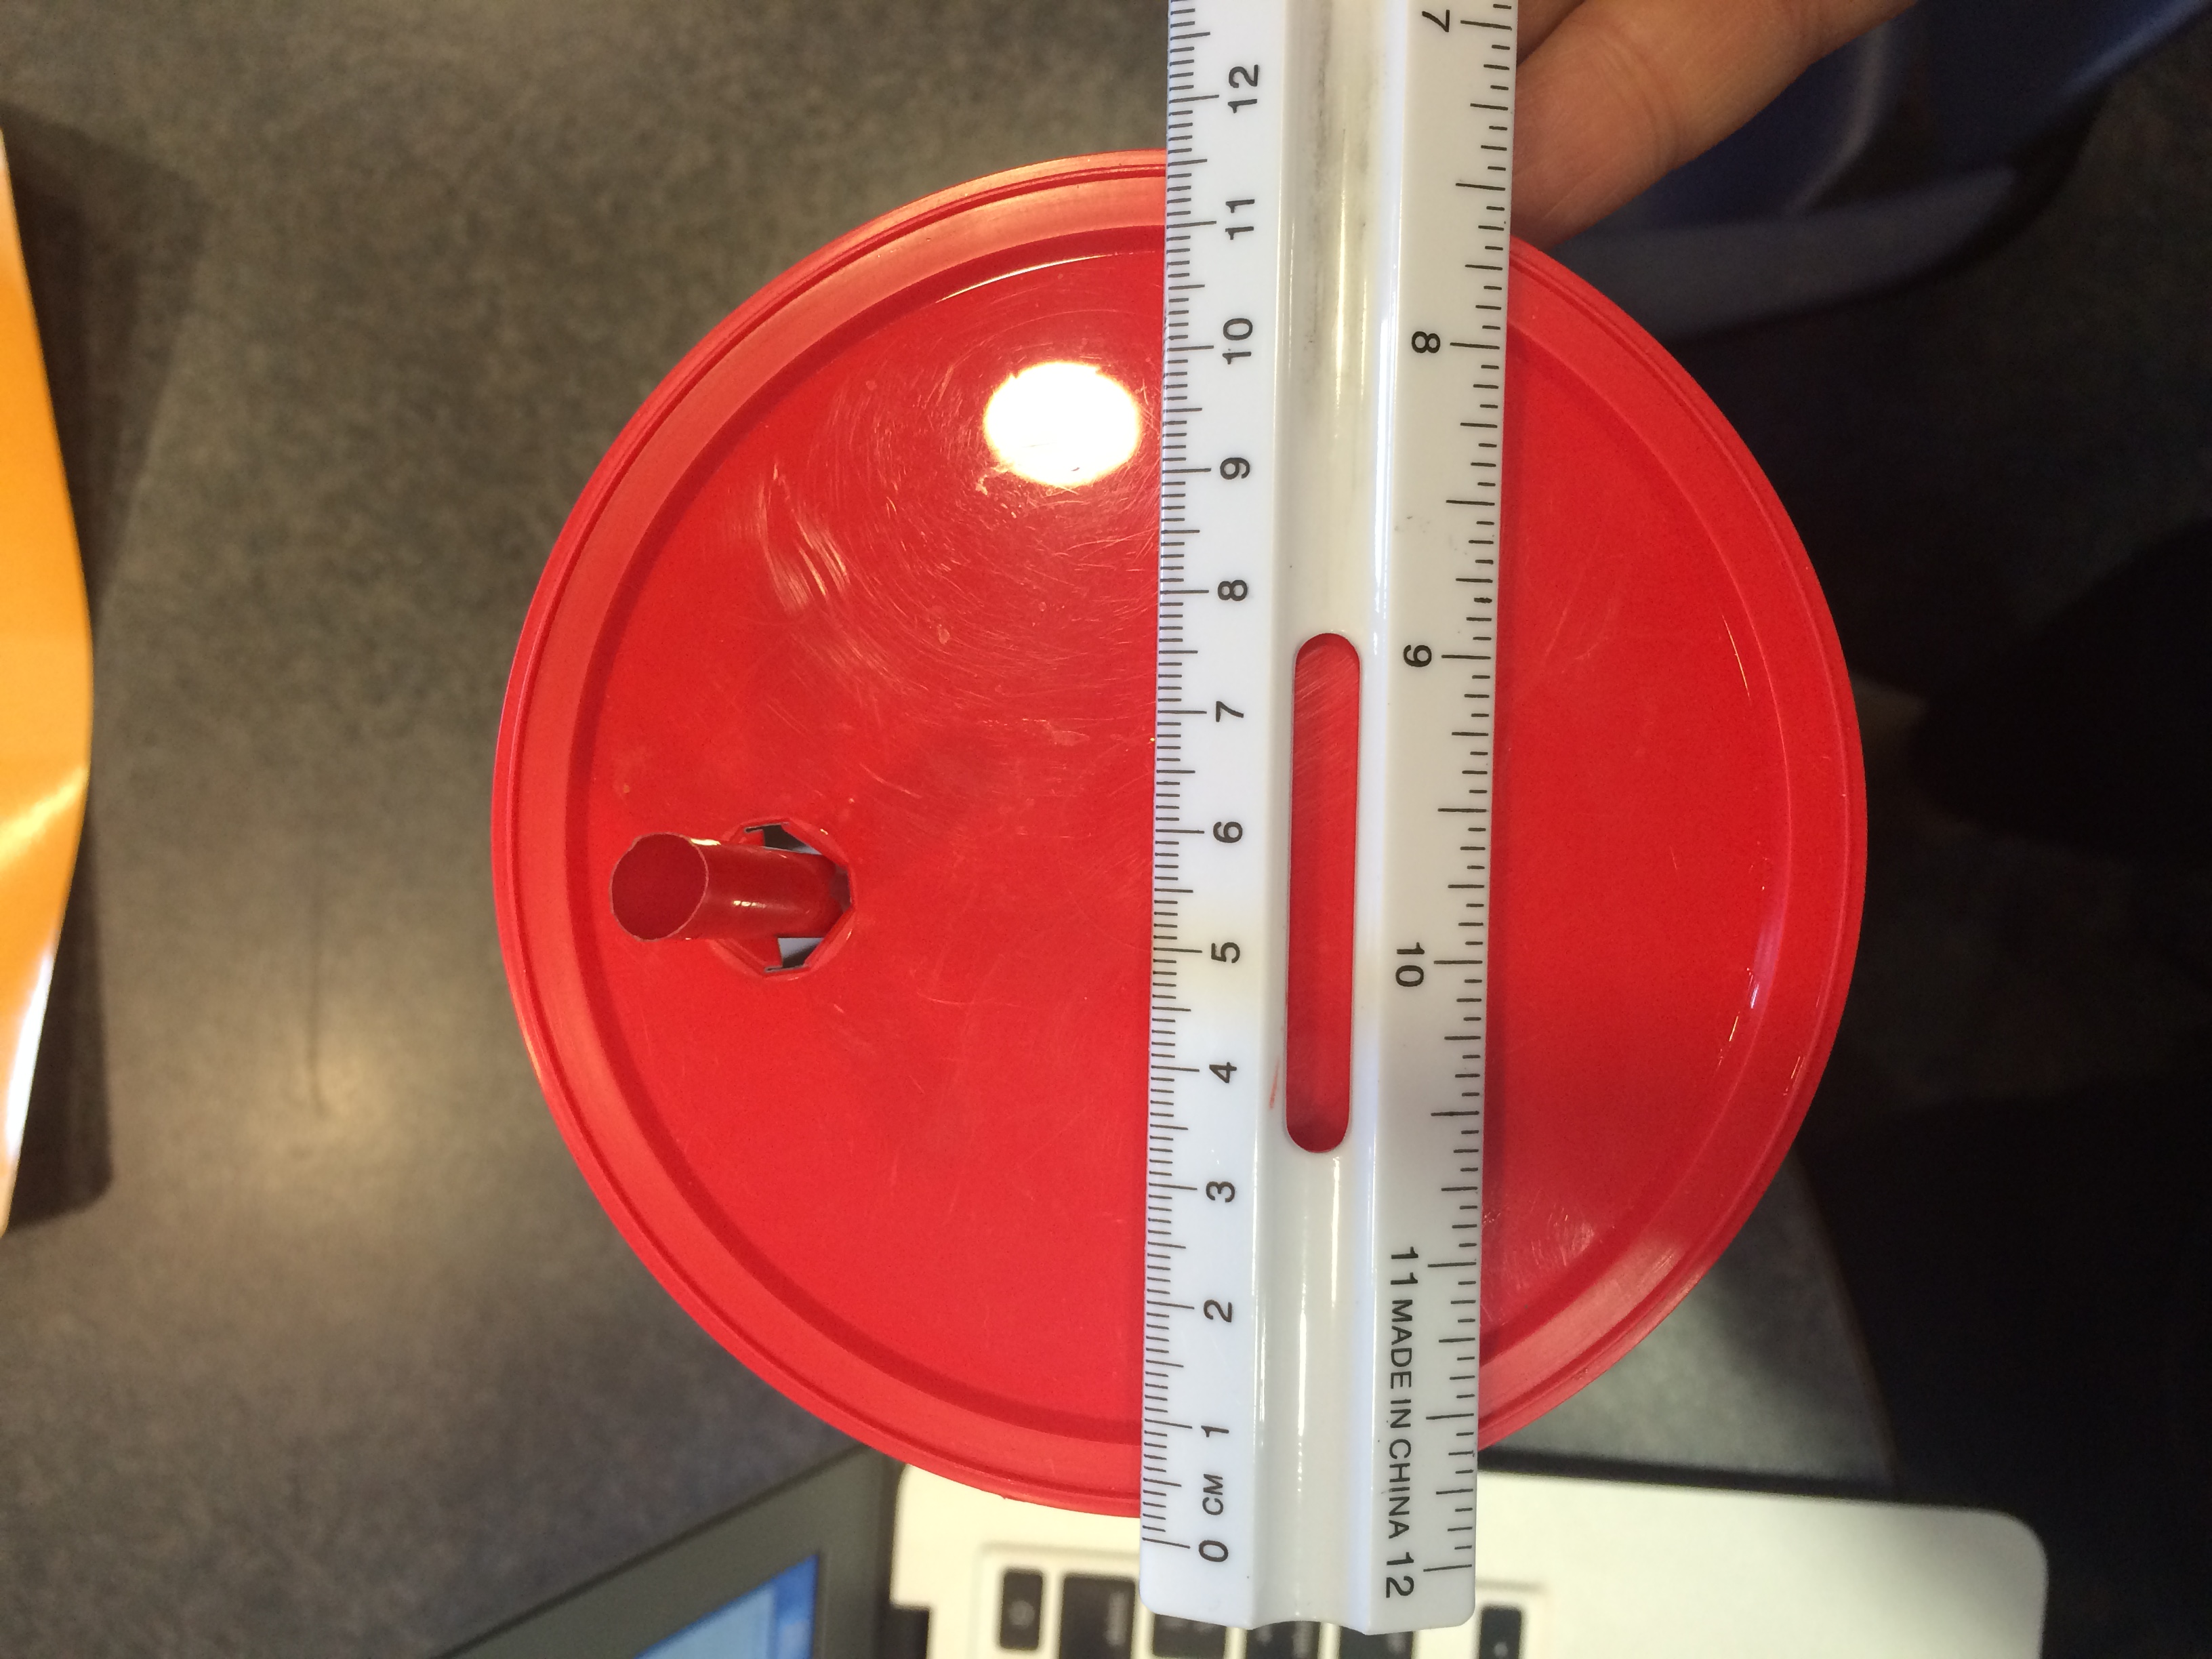
Step 1: Measure the diameter of a circle. I used the top of my QT cup in the picture below. I measured the diameter as 11.5 cm.
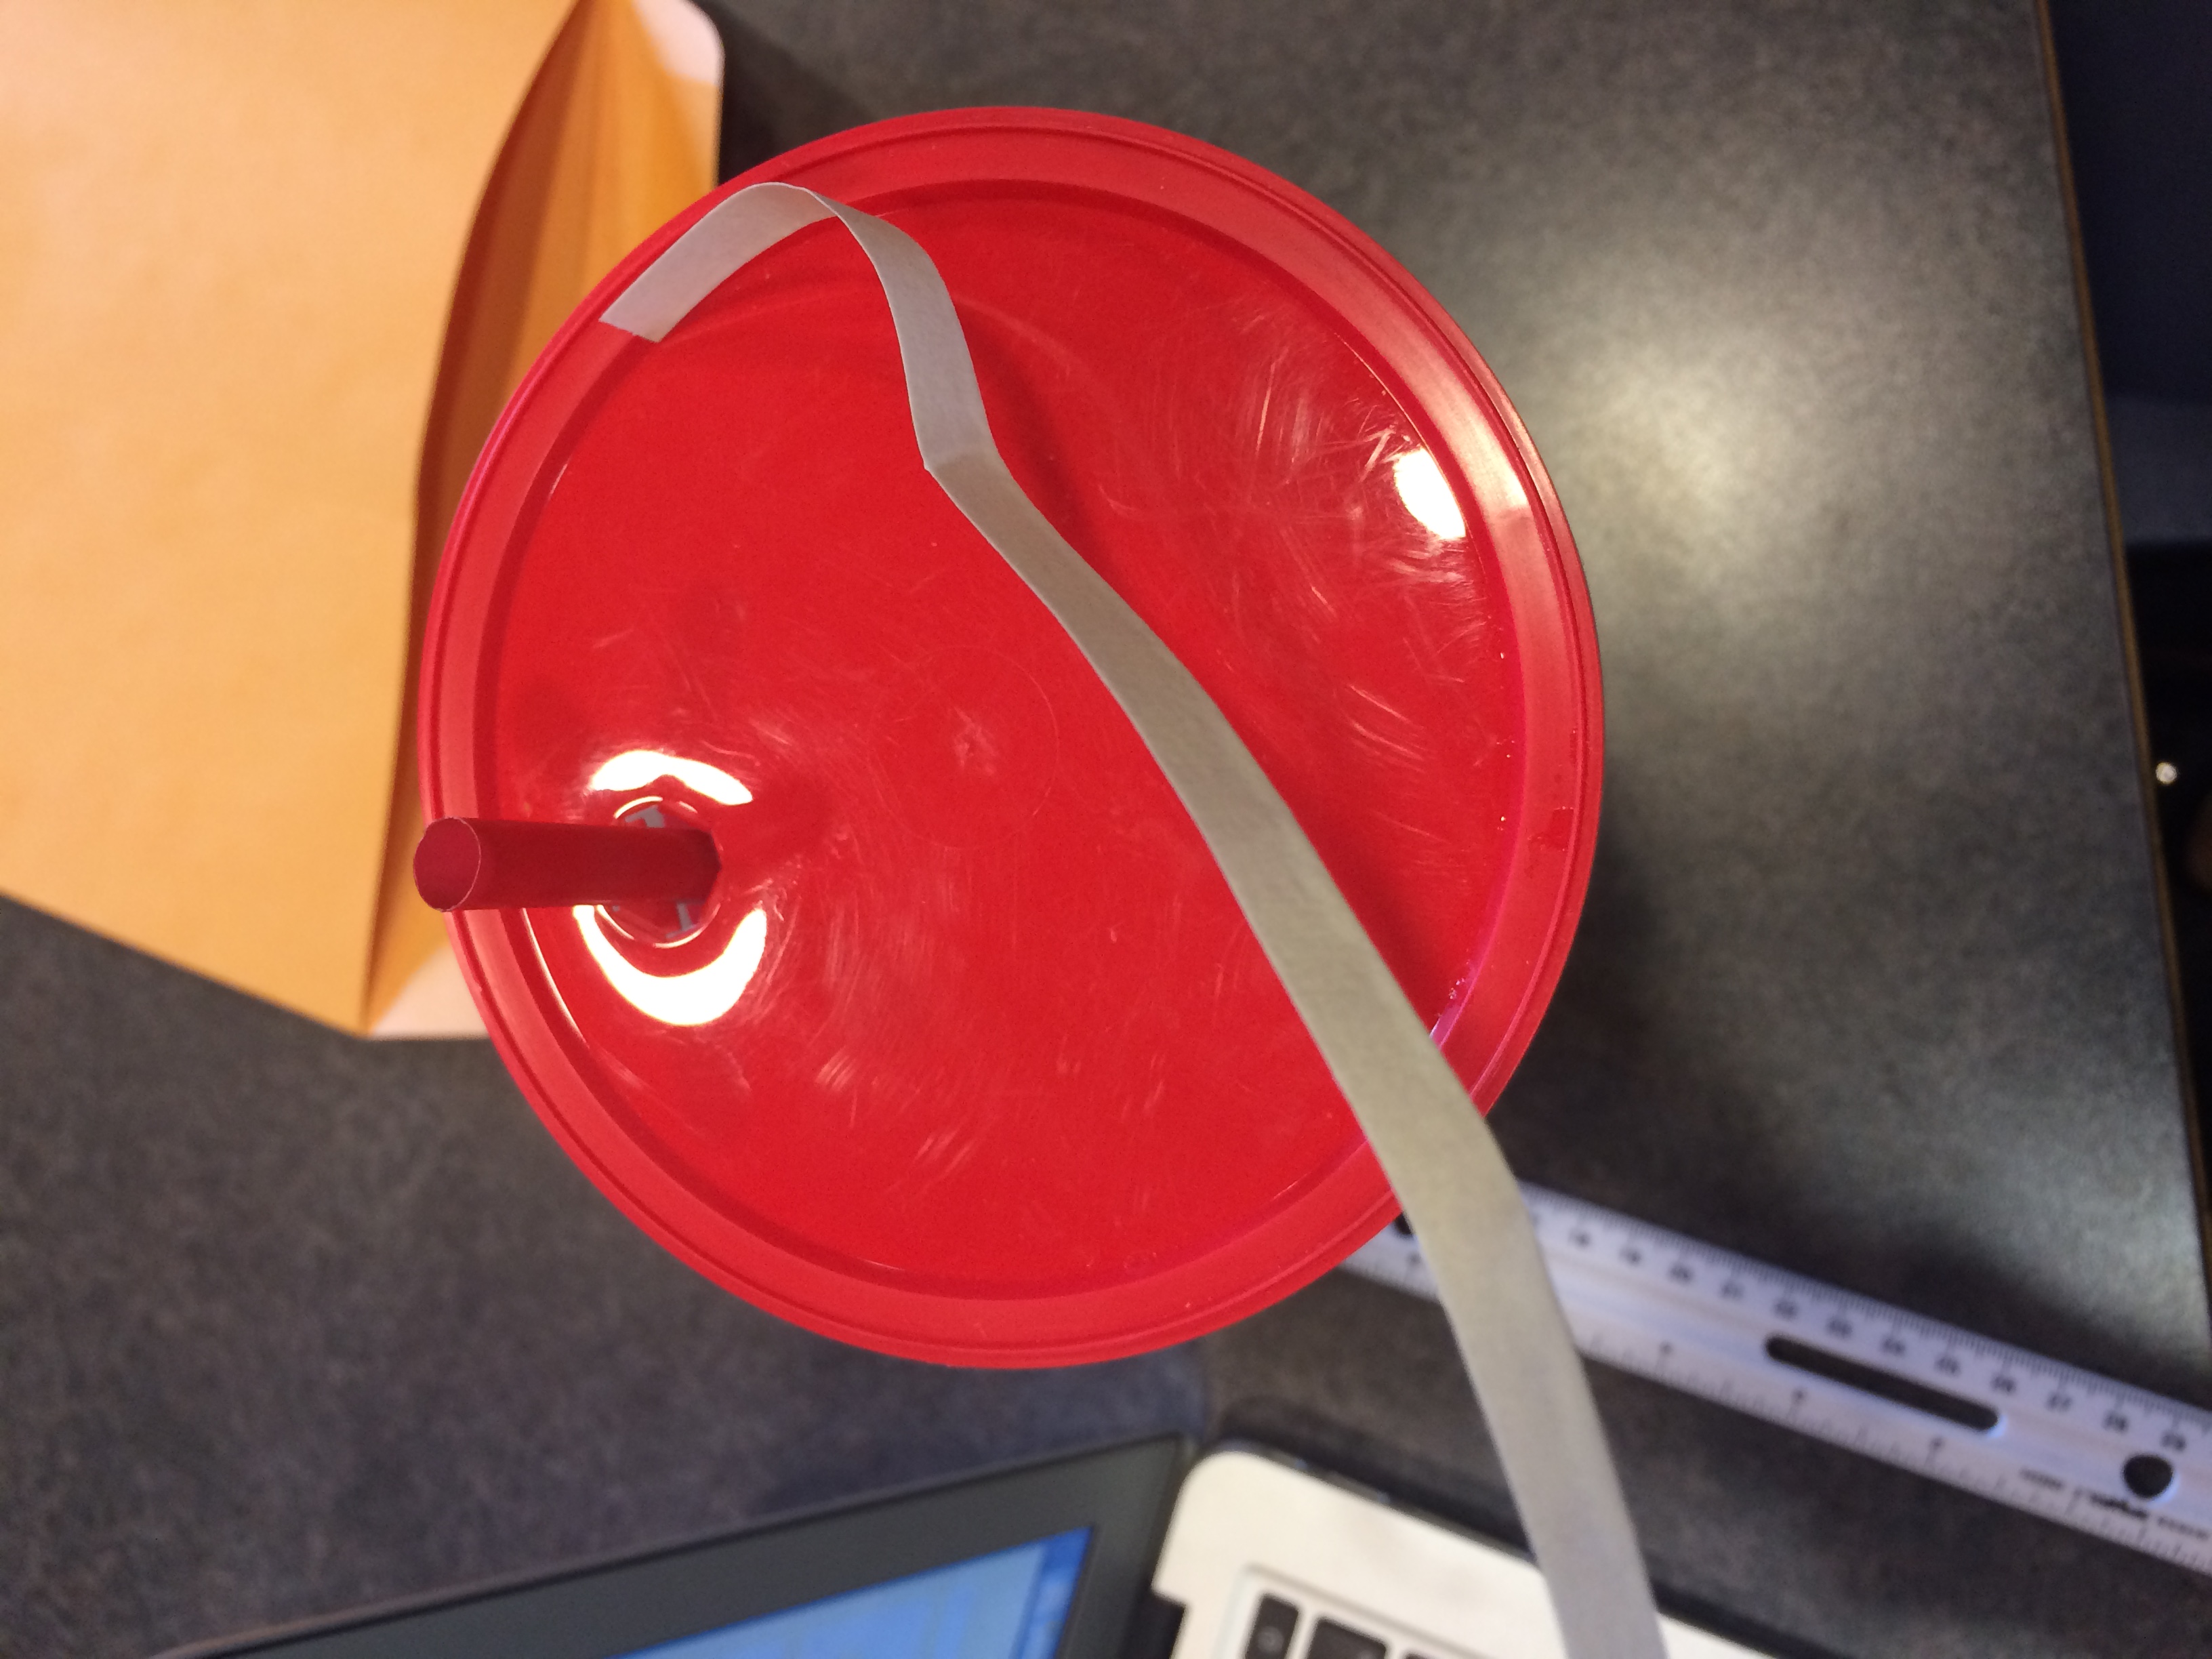
Step 2: Measure the outside of the circle (circumference) with a string (I used a piece of making tape folded in half because I didn’t have a string handy).
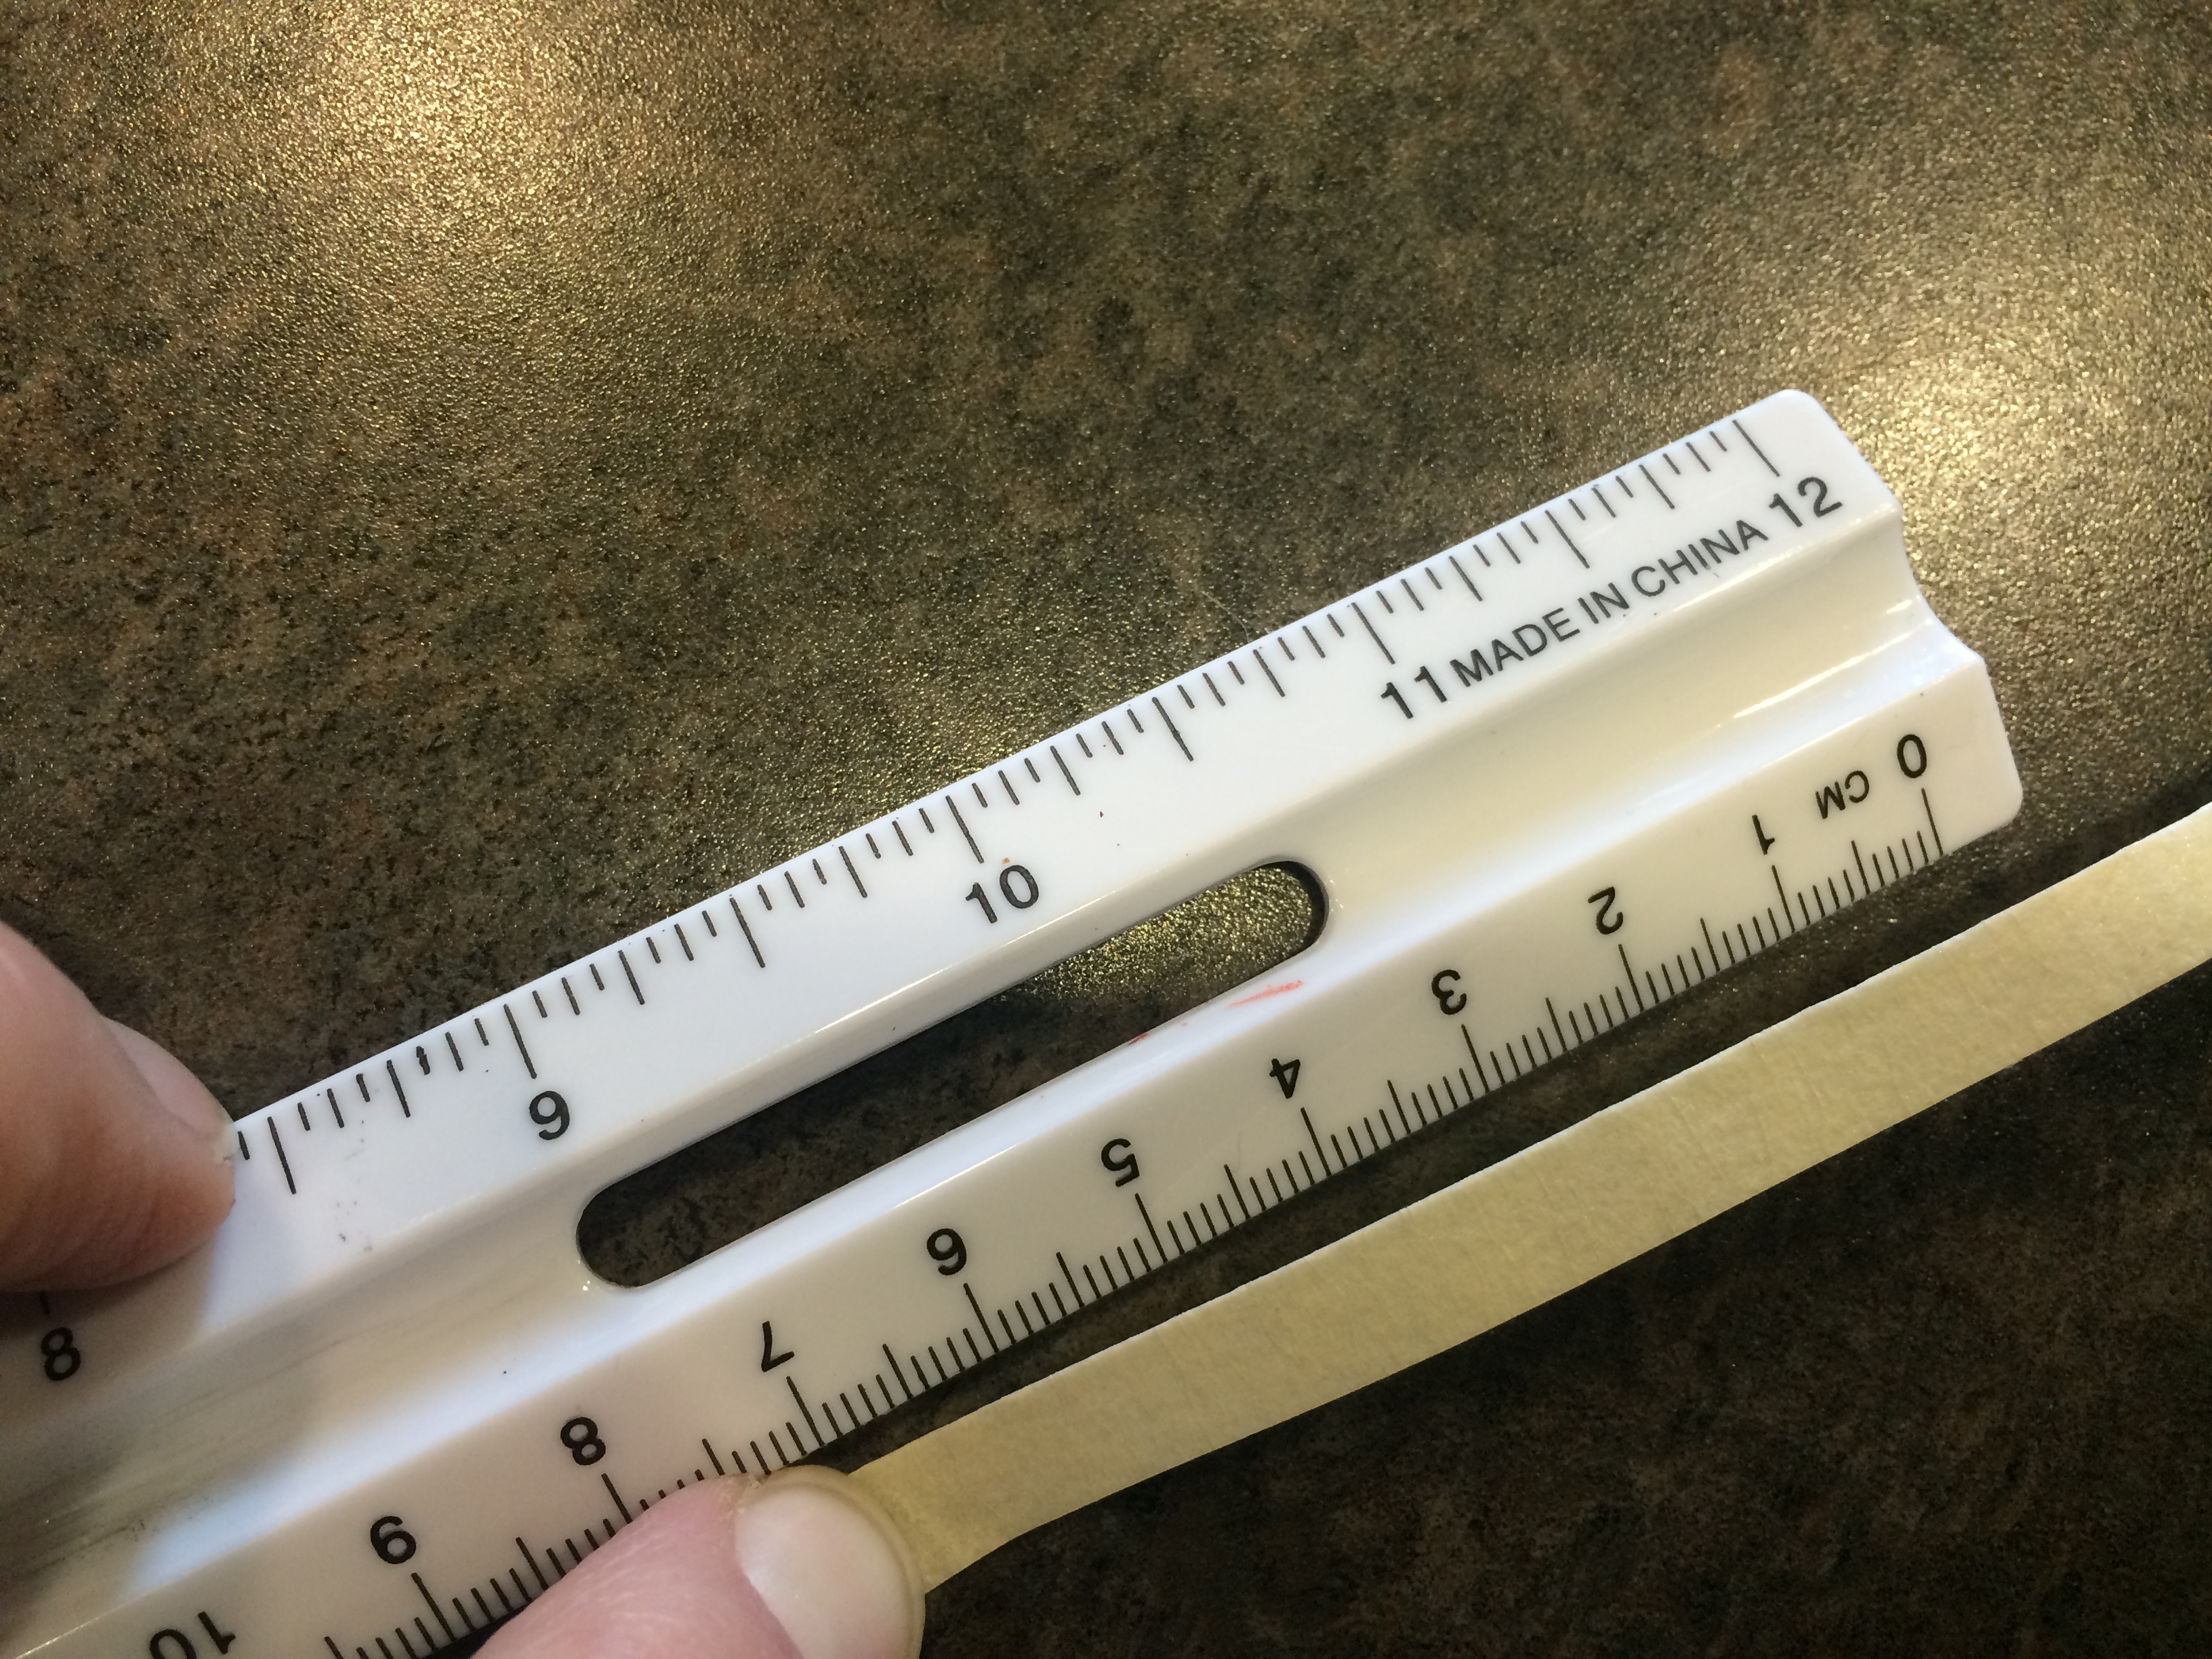
Step 3: Measure the string. I measured the circumference of my QT lid as 36.5 cm.
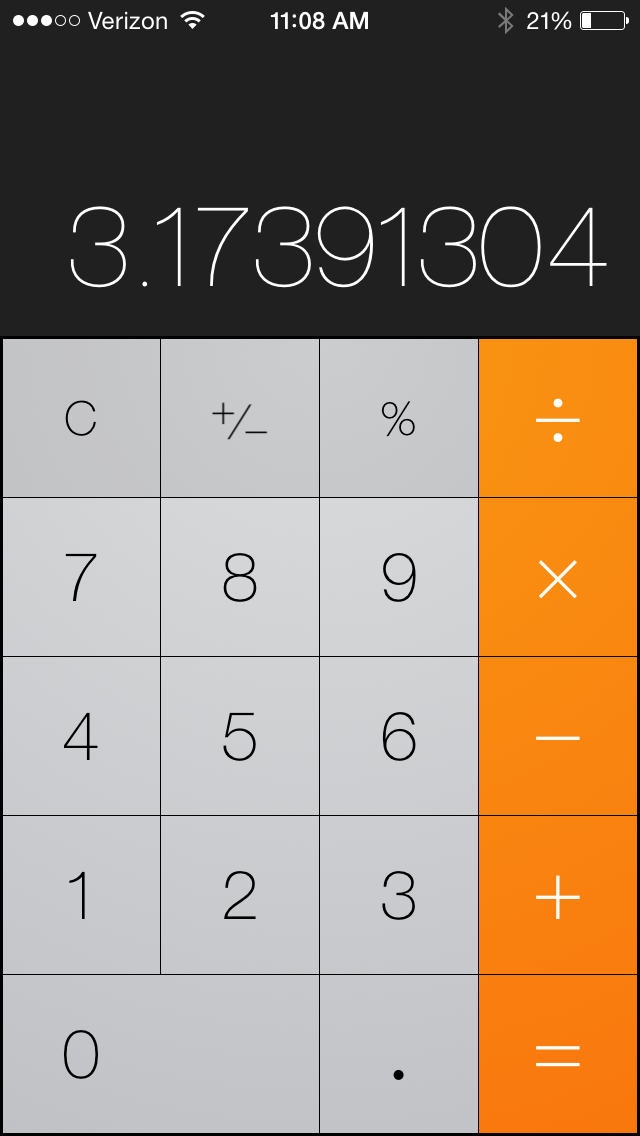
Step 4: Divide the circumference by the diameter (36.5 divided by 11.5).
I got 3.17391304. Not too bad!
5. Do steps 1-4 with your own circle. Record all of the math on your recording page.
6. Share your math mini spark recording page with your teacher/EY coordinator.

 Math concepts are fantastically weaved into all kinds of artwork and Cloud Gate, or “The Bean”, in Chicago, IL is no exception! Cloud Gate is British artist Anish Kapoor’s first public outdoor work in the the United States.
 infographic |ˌinfōˈɡrafik| noun- a visual image such as a chart or diagram used to represent information or data. a good infographic is worth a thousand words.

 Take Me out to the Ball Game! The baseball/softball season is upon us and what better way to prepare for the fun than by studying the ways in which math is used in these fine sports.


 Circles are EVERYWHERE, and wherever there are circles, there’s math to be done!