
Mean Absolute Deviation (MAD) is how far, on average, all data values are from the middle. To find the MAD of the you can follow 3 easy steps:
- Find the mean of the values.
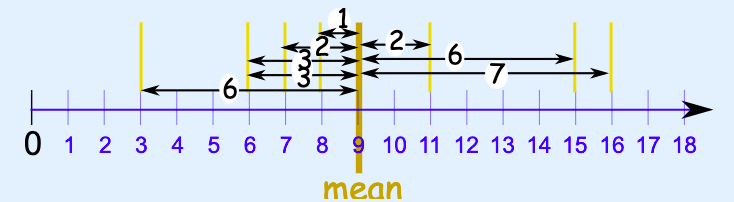
- Find the distance of each value from that mean (subtract the mean from each value, ignore minus signs which is also the absolute value)
- Then find the mean of those distances
For this Math Mini Spark, you’ll be finding the MAD on a spreadsheet.
Spark your math thinking!
- Set up your math mini spark recording page: #85 Spreadsheets and MAD
- Calculate the MAD of this data set: 3, 6, 6, 7, 8, 11, 15, 16
- Find the mean of the values.
- Find the distance of each value from that mean (subtract the mean from each value, ignore minus signs which is also the absolute value)
- Then find the mean of those distances
- Look over the first part of this post from Math is Fun that outlines the steps. Make sure that each of the steps you did were correct.
- Make a Copy of this spreadsheet by clicking the link: https://docs.google.com/spreadsheets/d/1ndcgCZ1EeVcKausxtkmBkONVfCeilbQNE6ukdUCWYk8/copy
- Watch the video and complete the steps shown in the video on your own spreadsheet.
7. Share your math mini spark recording page with your teacher/EY coordinator.
NOTE: This mini-spark can be used as 1 spreadsheet lesson for the Spreadsheet Superstar Badge.
